
A server rarely fails at a convenient time. The disk fills up on a Saturday night. A SIP trunk drops registration and nobody notices until customers complain on Monday. A certificate expires and the portal stops loading for your agents.
Every one of those has a simple fix, as long as somebody sees it early. That is the whole argument for monitoring, and it is why every customer on our yearly support plan has their servers connected to ICT Monitor.
It is not tied to our software. If it is a Linux box running Asterisk, FreeSWITCH, or an ordinary web and database stack, we can watch it. Most of the nodes on it happen to run our products, because those are the customers we have, but nothing in the agent asks what vendor wrote the application.
Below is what it actually does, with screenshots from a live installation. Customer names and hostnames have been changed.
One page for every server we look after
Our support team opens one page and sees the whole estate: state, load, memory, disk, the telephony engine, uptime, and every open problem with how long it has been open. Worst first, colour coded.
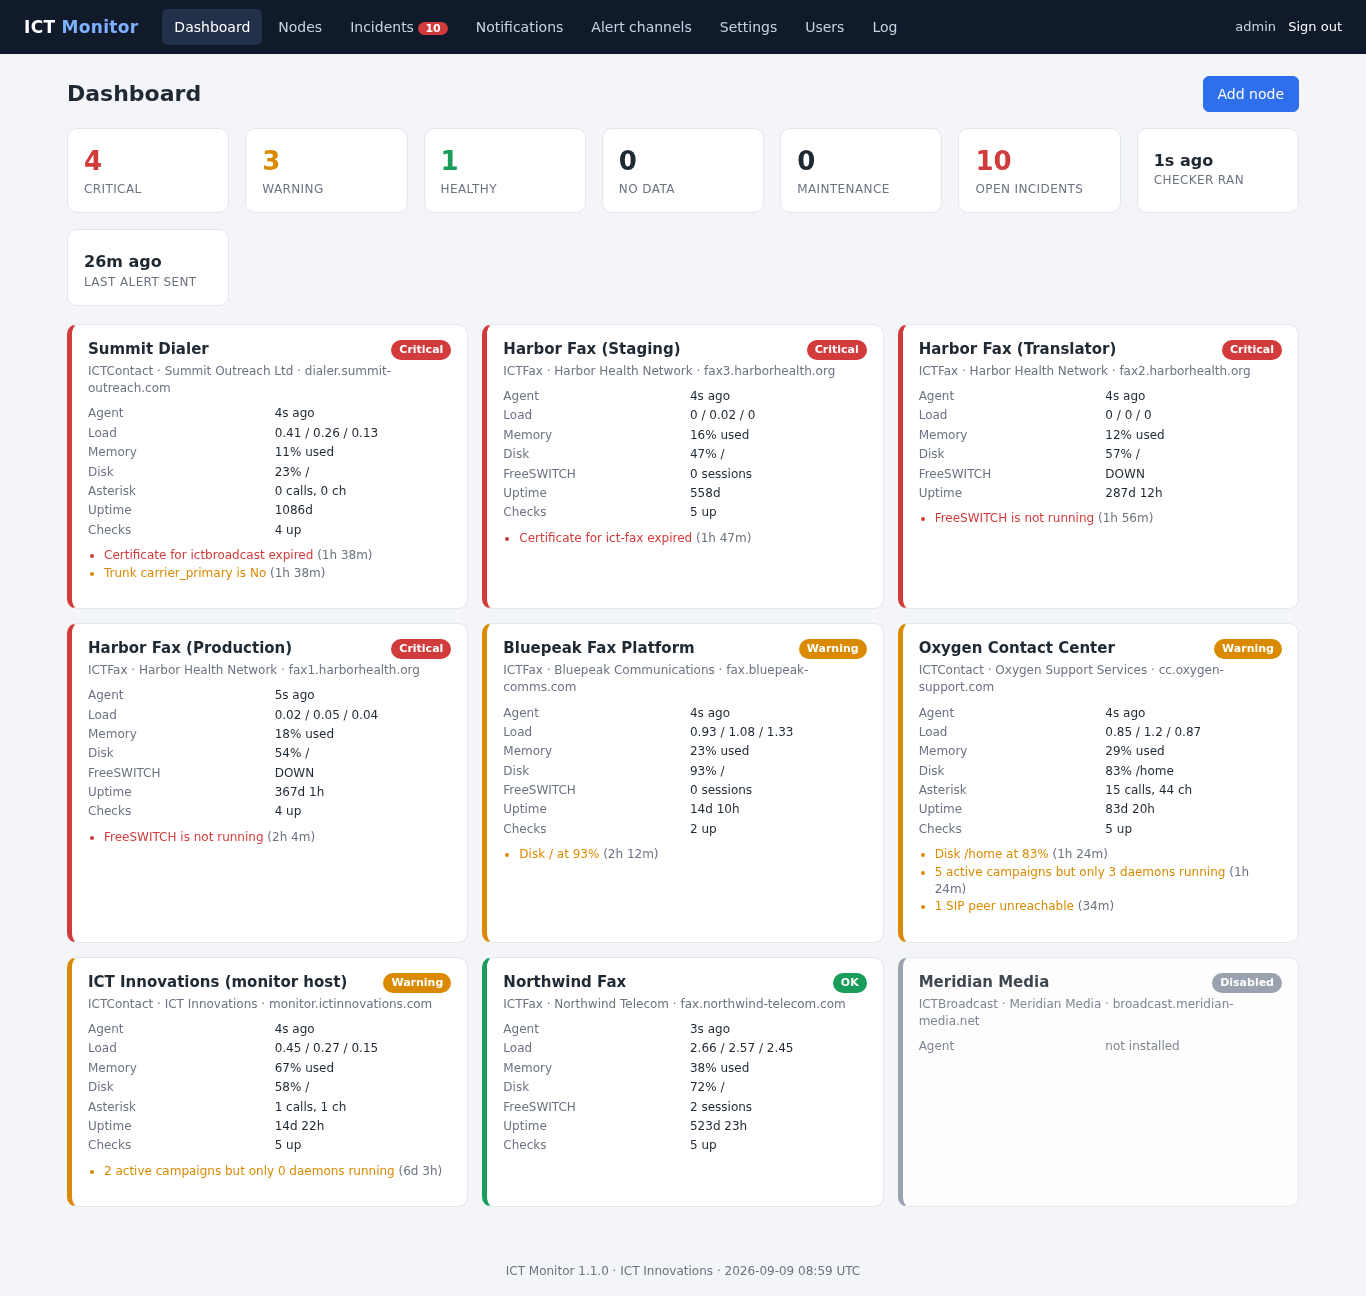
The value here is not the cards. It is that a server which has gone quiet looks different from a server that is fine. An agent that stopped reporting is itself a critical problem, because the most dangerous failure is the one that also takes out your ability to see it.
Two vantage points, because one is not enough
Every node is watched from two directions at once.
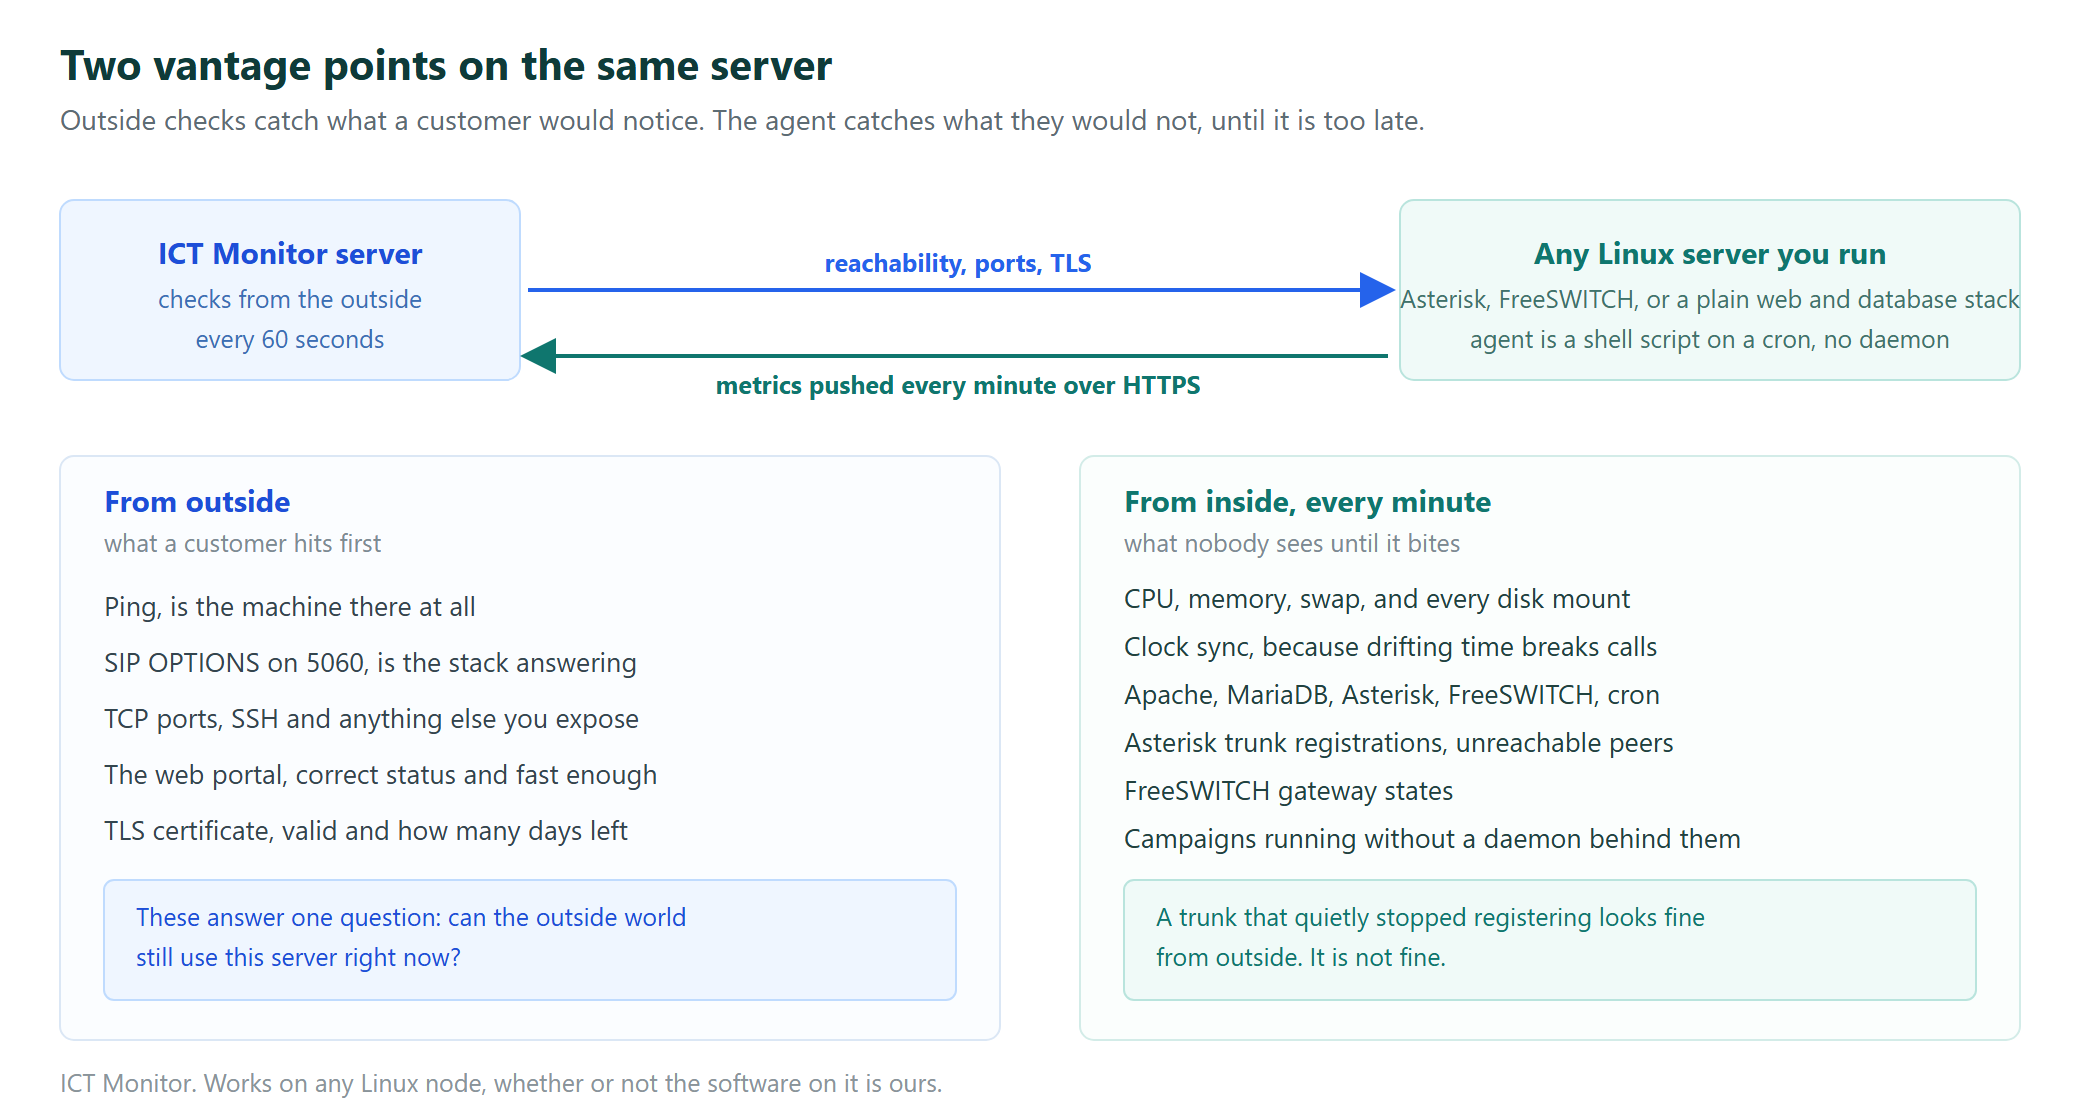
From our monitoring server we check the things your users hit first. Is the machine reachable. Is SIP answering on 5060. Is SSH open. Does the web application load with the right status and inside a sensible time. Is the certificate valid, and how many days are left on it.
On the node itself a small agent reports every minute. It is a shell script on a cron entry, nothing to compile and no daemon to keep alive. It covers CPU load, memory, swap and every disk mount, clock synchronisation, the systemd units that matter, whether MySQL still answers, and whether the local web server still serves its own interface.
On an Asterisk or FreeSWITCH node
It adds the telephony layer: Asterisk trunk registrations and unreachable peers, FreeSWITCH gateway states, active channel and call counts. A trunk that has quietly stopped registering looks perfectly healthy from outside, and is not.
On dialer and campaign platforms it checks one more thing that catches people out: whether every active campaign actually has a running daemon behind it. A campaign can sit marked active with nothing dialling at all.
On a plain Linux web node
You list the systemd units you care about in the agent config, and it watches those instead: Apache or nginx, MariaDB or PostgreSQL, PHP-FPM, your own service. Everything else, the disks, the memory, the certificate, the response time of the application itself, works exactly the same. A help desk, a CRM or a customer portal gets the same treatment as a switch.
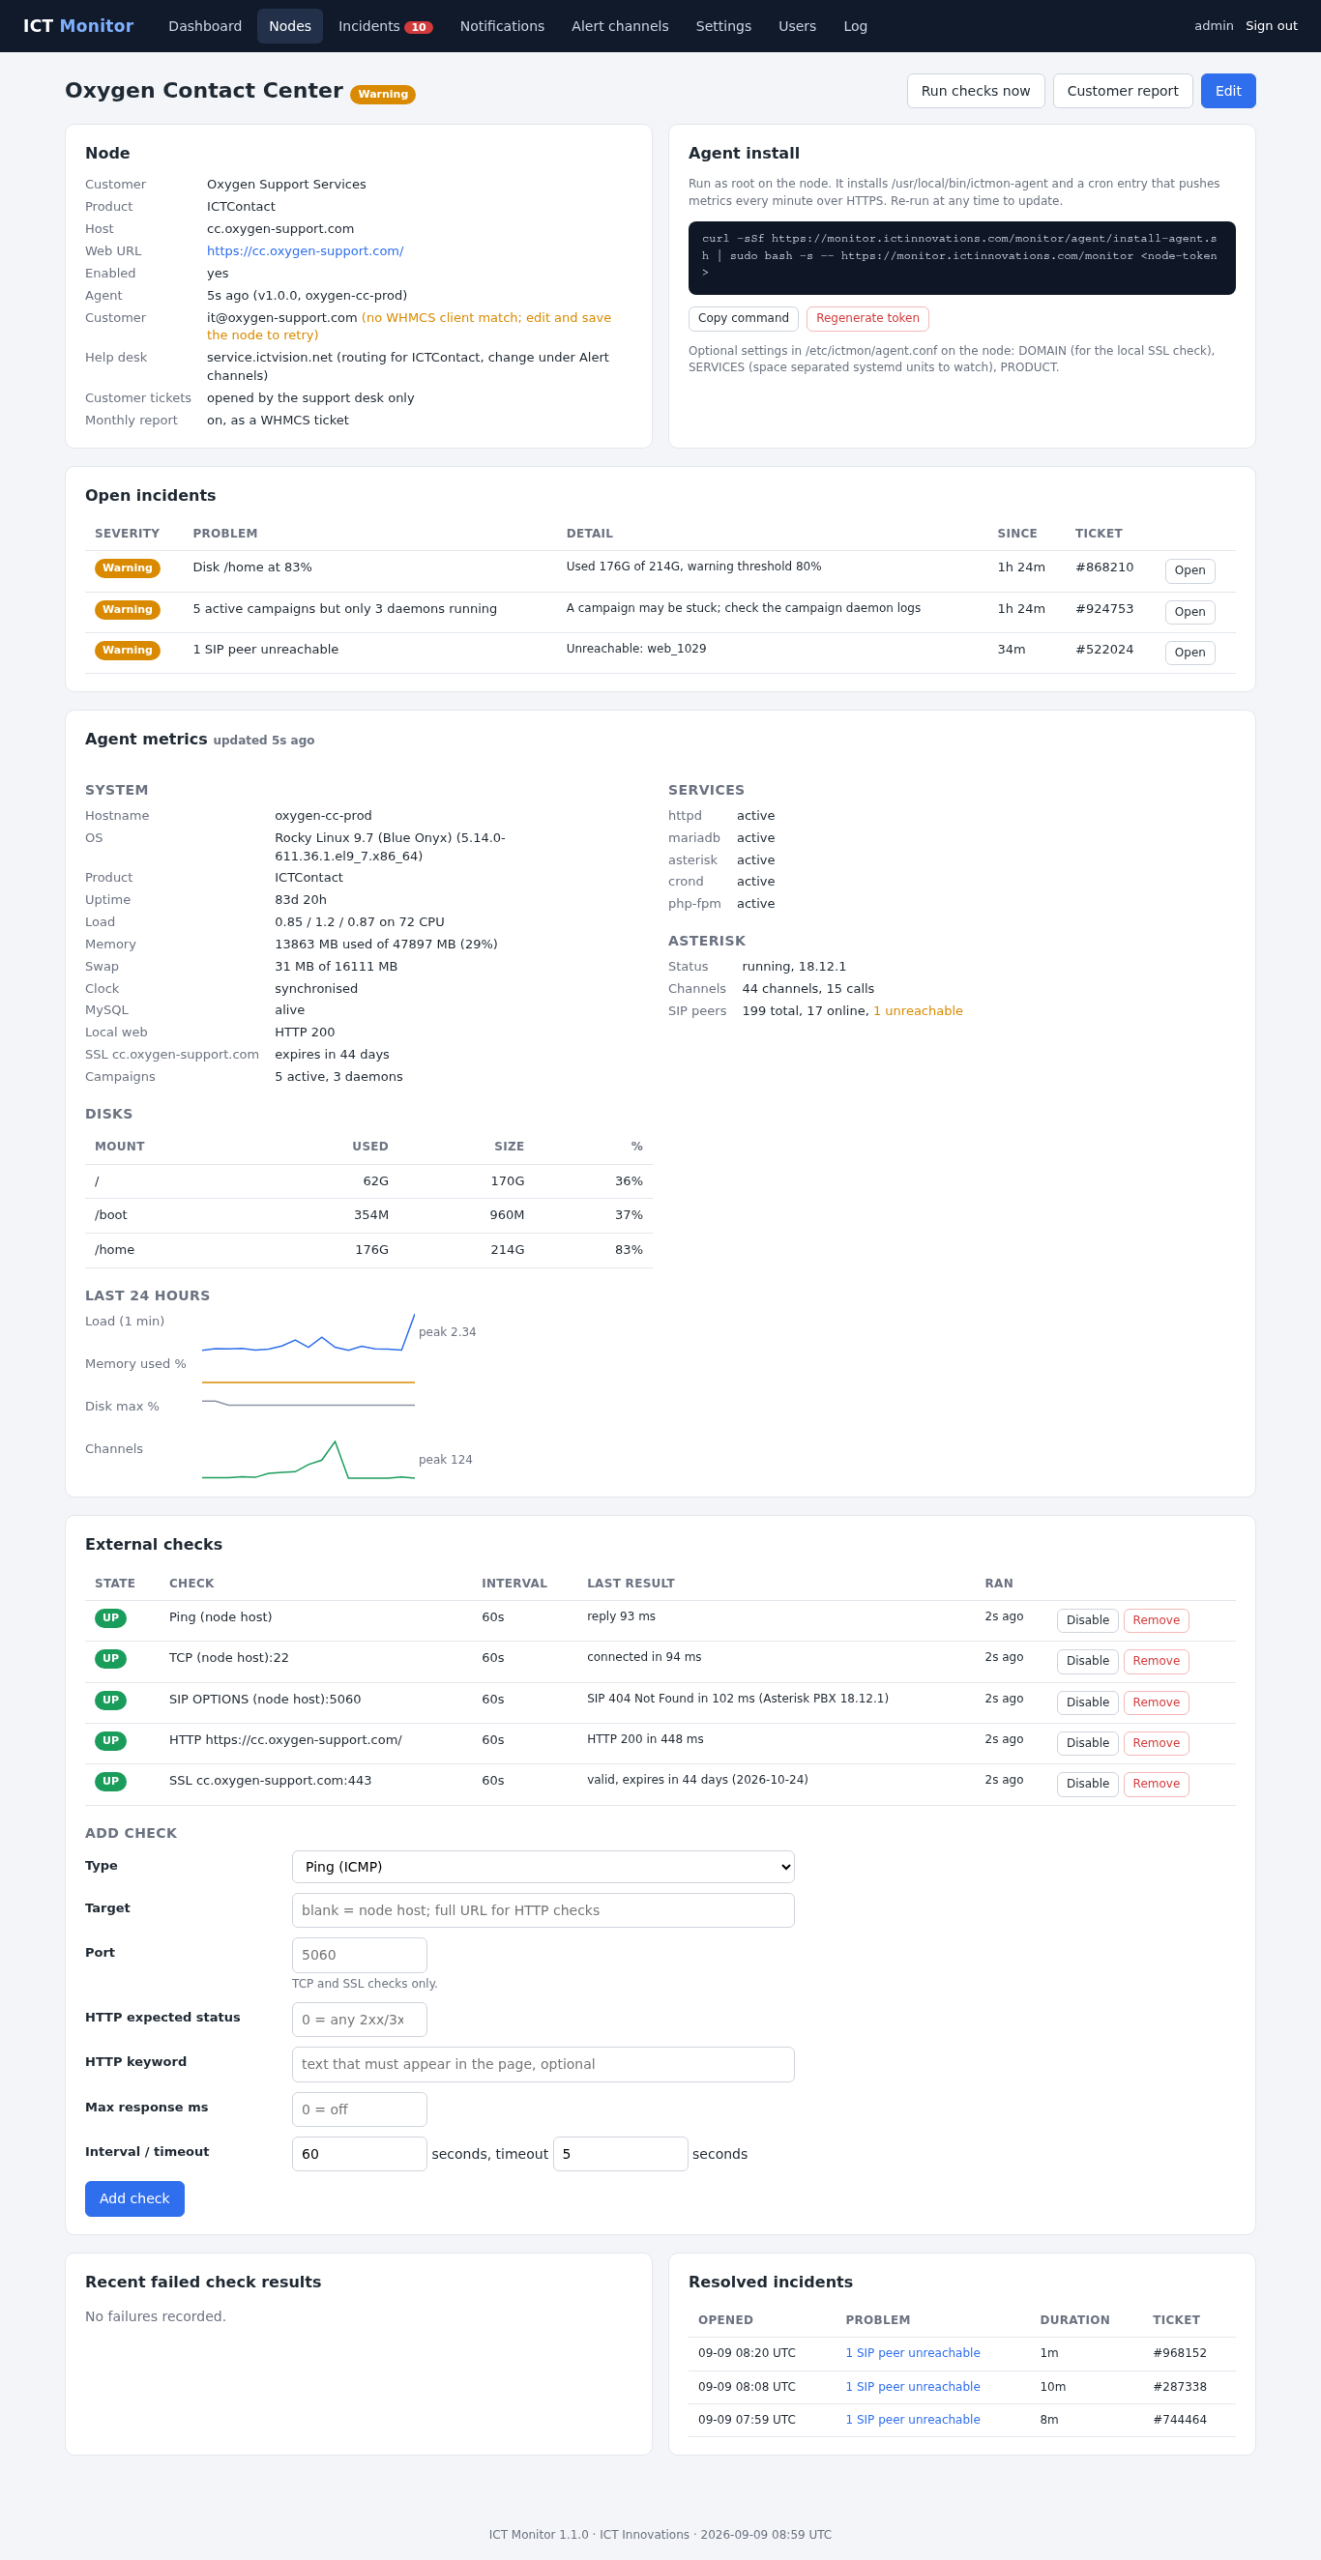
Those 24 hour graphs matter more than they look. When you call us, we already know what your server looked like an hour ago, so the conversation starts at the diagnosis rather than at “can you send us the output of top”.
A ticket when it matters, silence when it does not
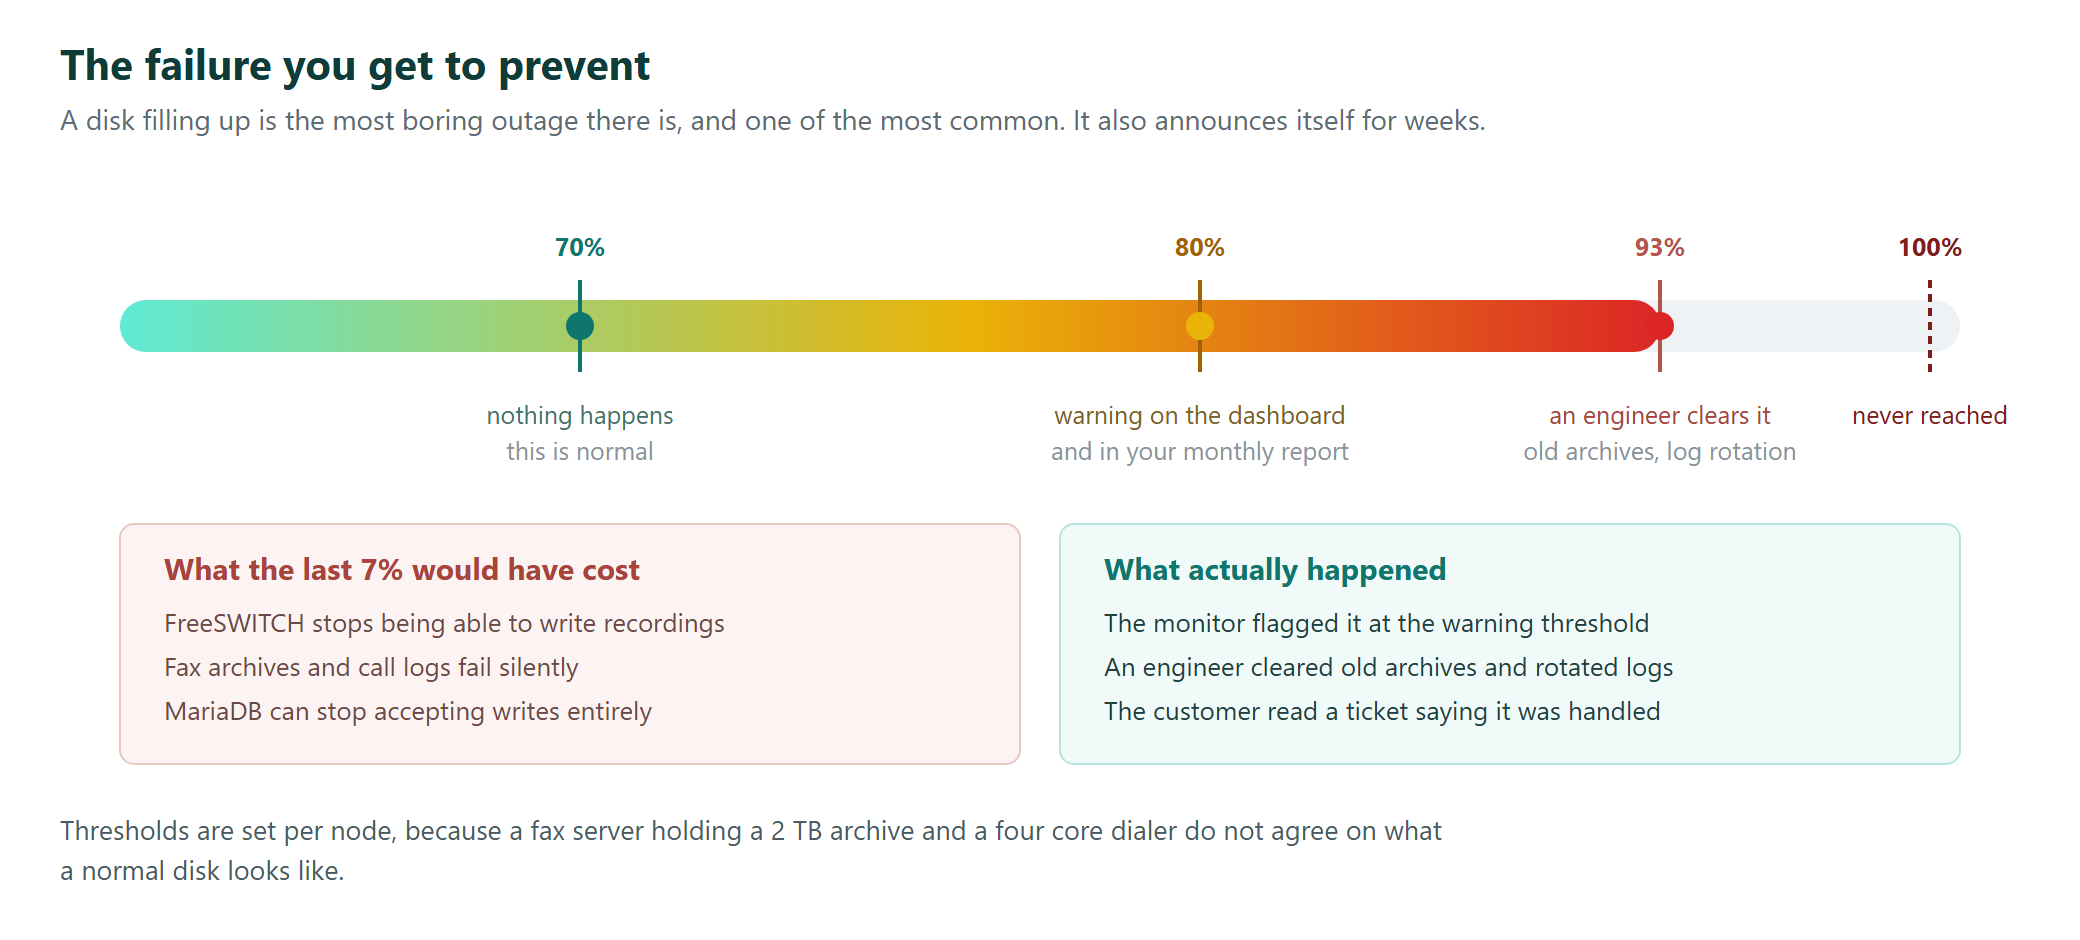
Nobody wants a mailbox full of alerts. An alert that arrives at three in the morning about something nobody can fix until Monday is not monitoring, it is noise, and the cost of noise is that people stop reading the real ones.
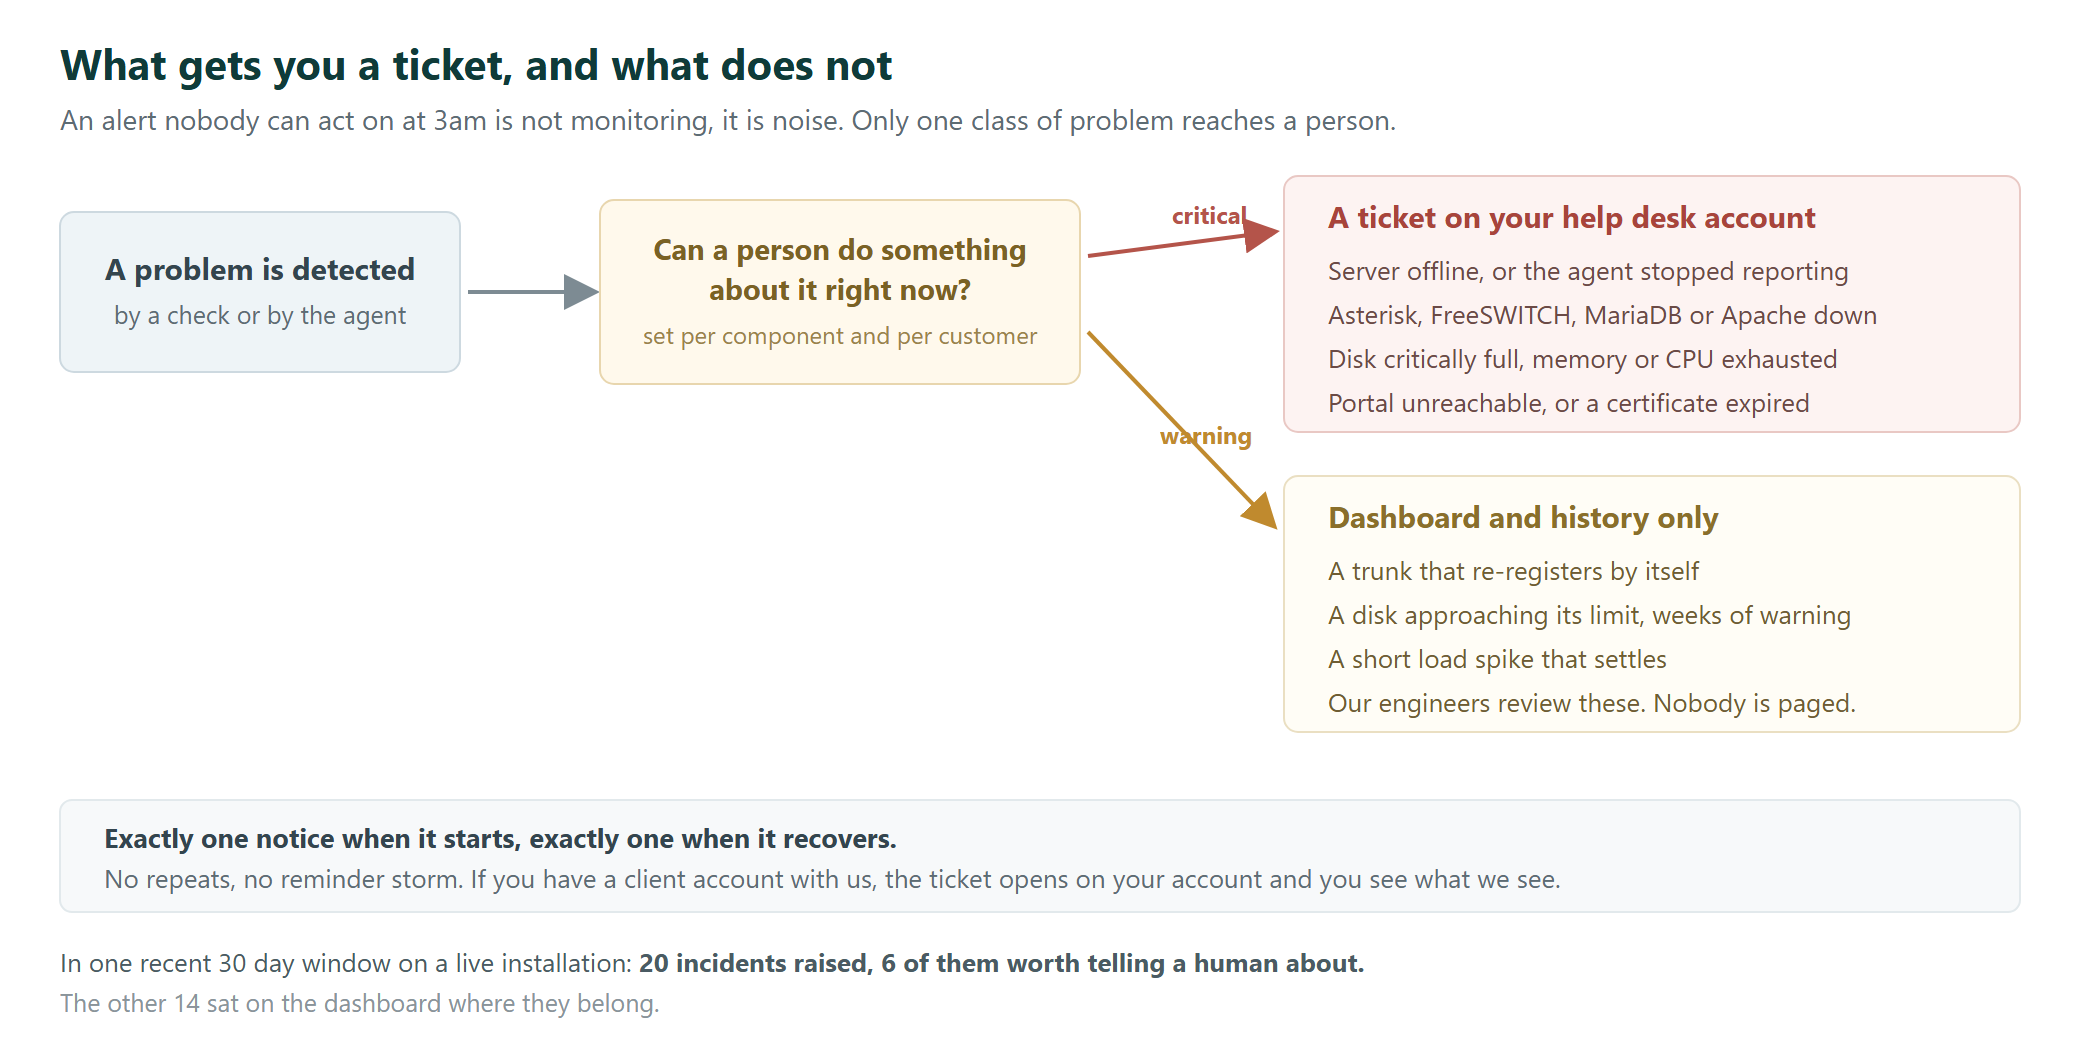
So a ticket opens only for problems that need a person. The server is offline. A service you told it to watch is down. A disk is critically full. CPU or memory has been exhausted for a sustained period, not for a moment. The main application is unreachable. A certificate has expired rather than merely approaching expiry.
Everything else stays on the dashboard and in the history, where our engineers review it. A trunk that re-registers by itself, a disk climbing towards its limit with weeks of warning still in hand, a load spike that settles. Real, worth knowing, not worth waking anyone.
Each problem sends exactly one notice when it starts and one when it recovers. No repeats.
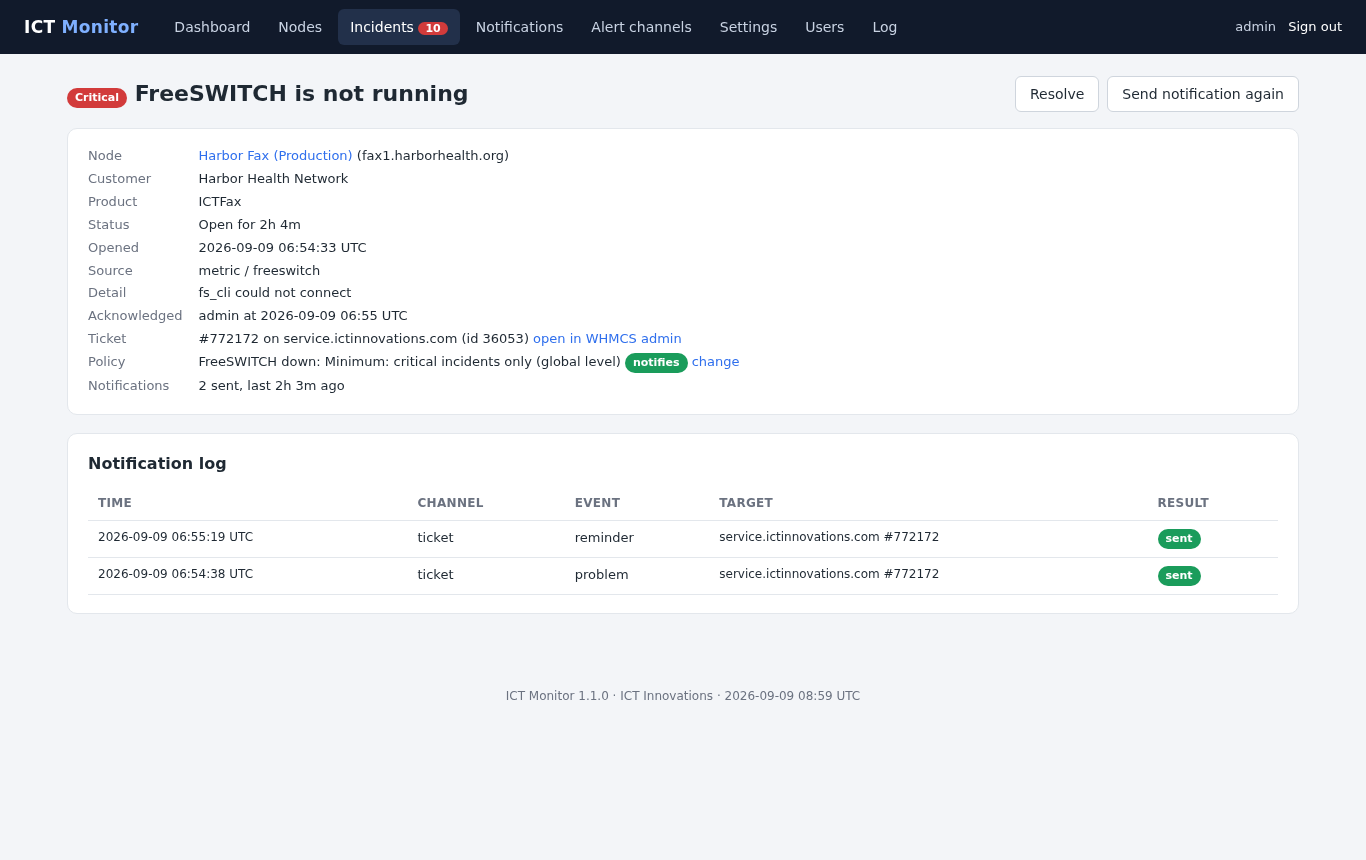
If you hold a client account on our help desk, the ticket opens on your account. You get the same email we do and can follow the whole thing from your client area. And the level is tunable per component and per customer, so if you genuinely do want to hear about every trunk hiccup, you can have that.
The failure you get to prevent
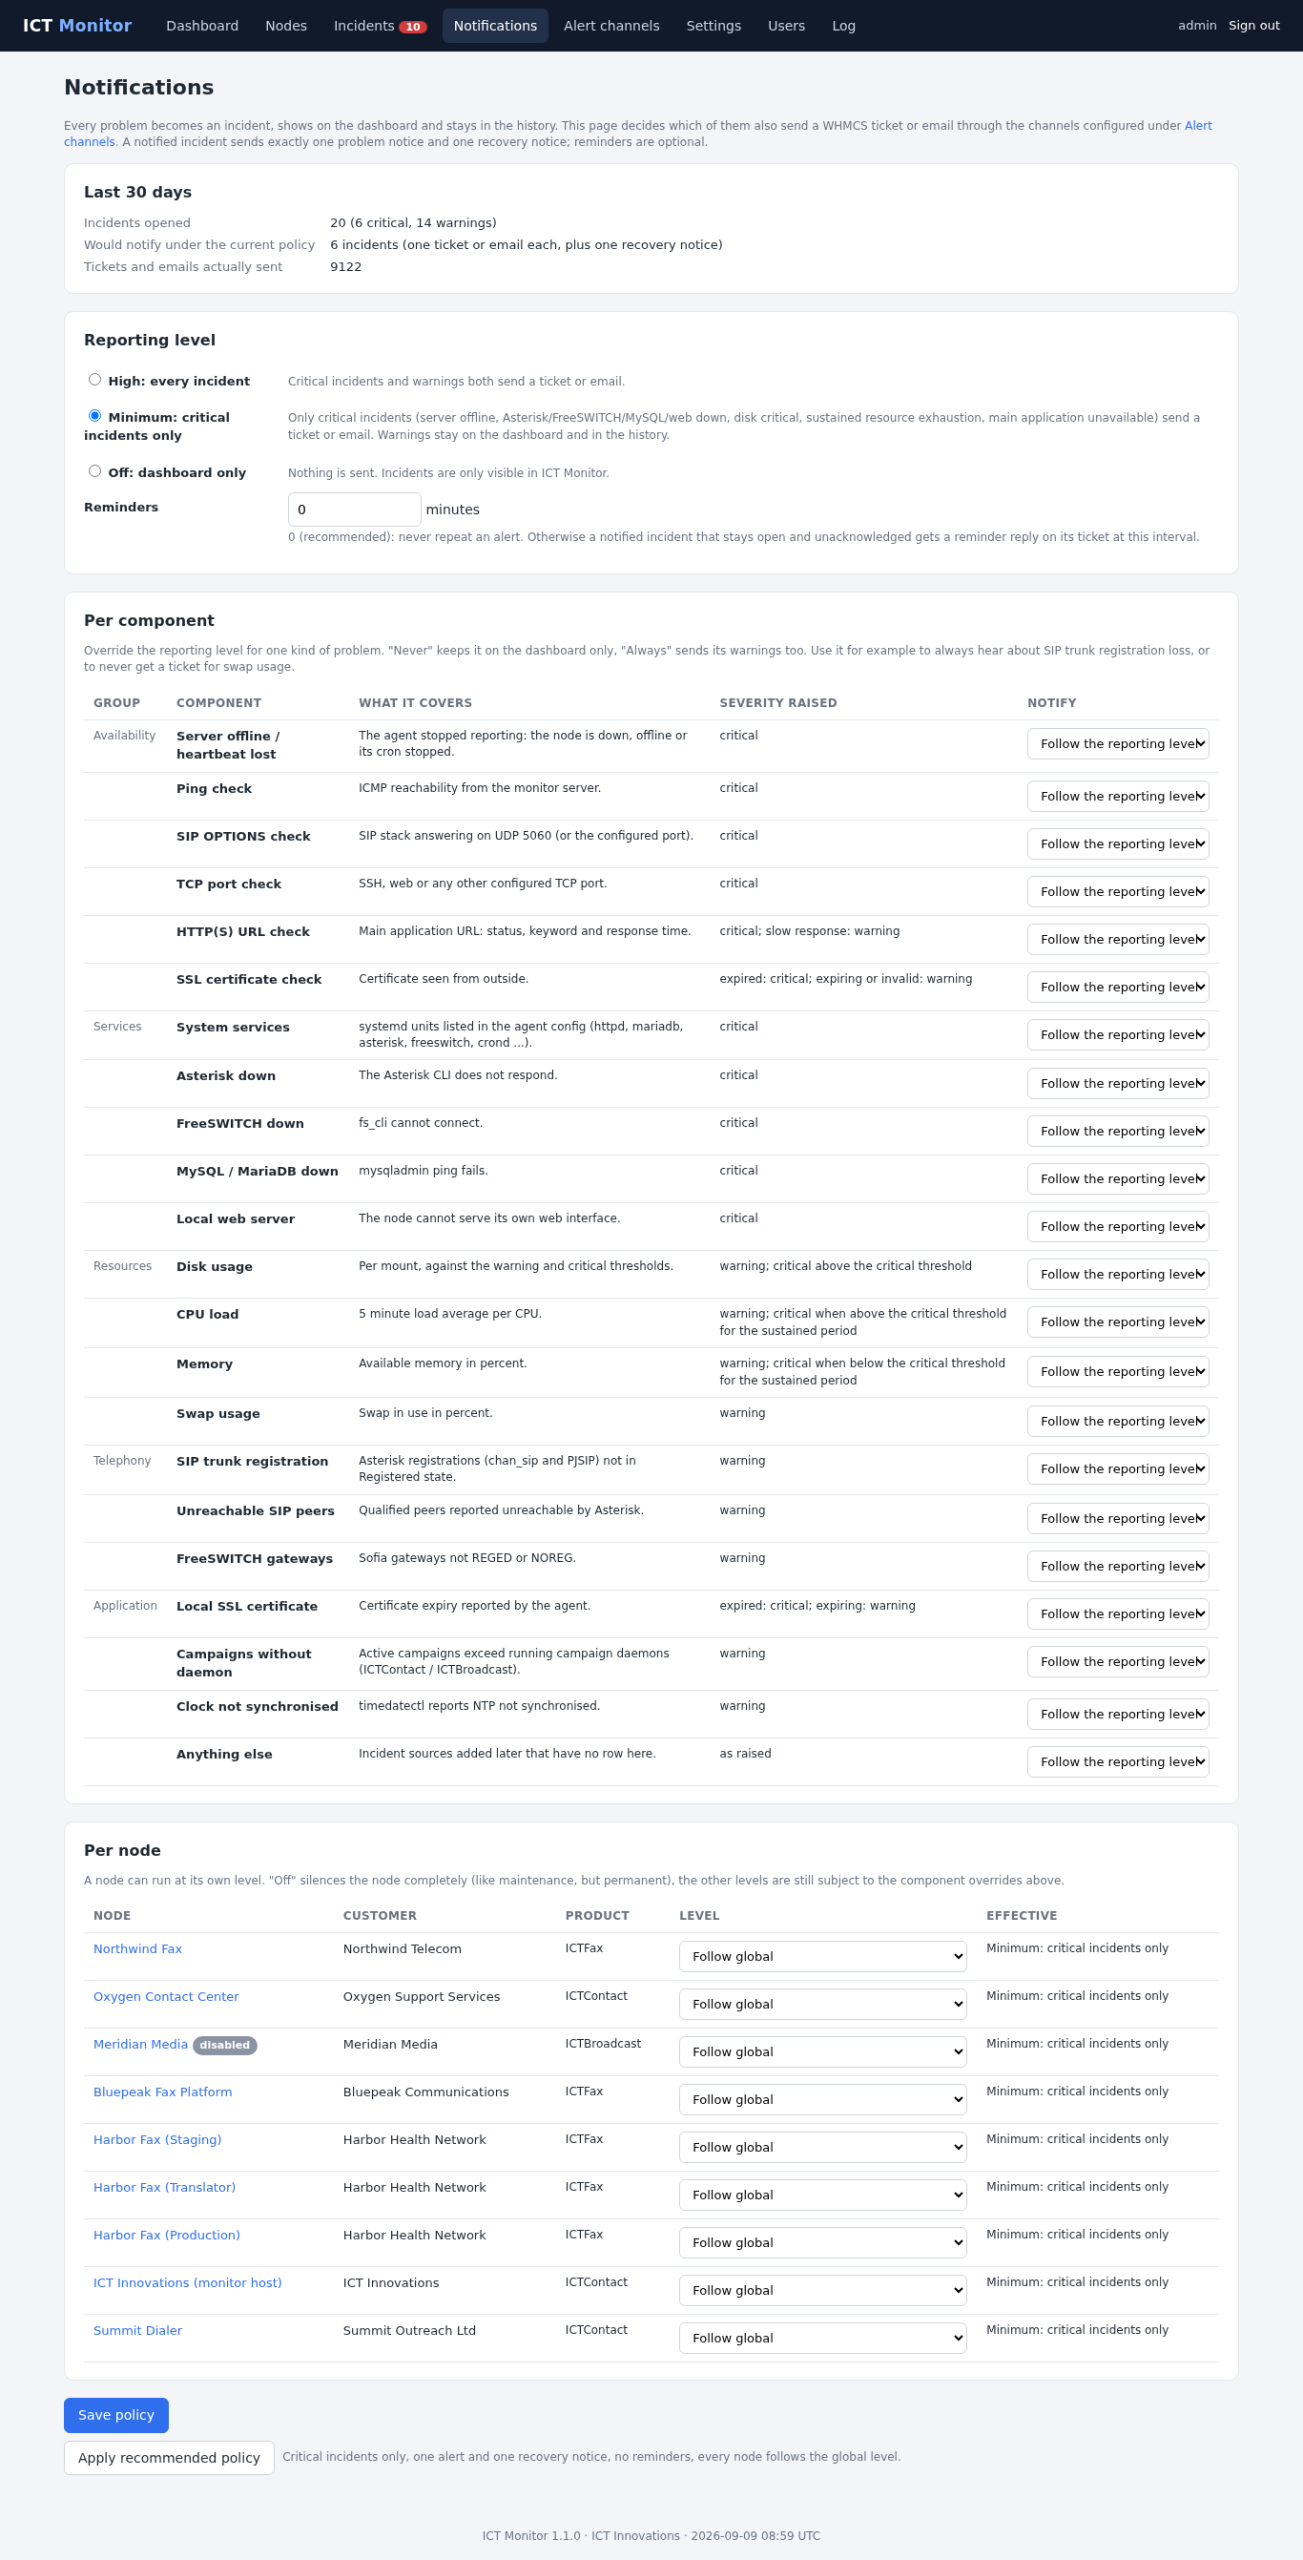
Here is a real one from a recent week, and it is deliberately unglamorous.
A customer’s fax node had its root disk climb to 93 percent. The monitor raised a warning, the monthly report flagged it with a recommendation in plain language, and an engineer cleared old archives and rotated logs before it reached the point where FreeSWITCH would refuse to write recordings. The customer’s only involvement was reading a ticket that said it had been handled.
Nobody was woken up. Nothing went down. That is what the service is for.
A health report every month
On the first of each month you get a report for your node. Availability and downtime, incidents with their ticket numbers, disk usage per mount, memory and CPU over the period, uptime, service states, trunk or gateway status, peak channels, certificate expiry, and a short list of recommendations written for a person rather than for a machine.
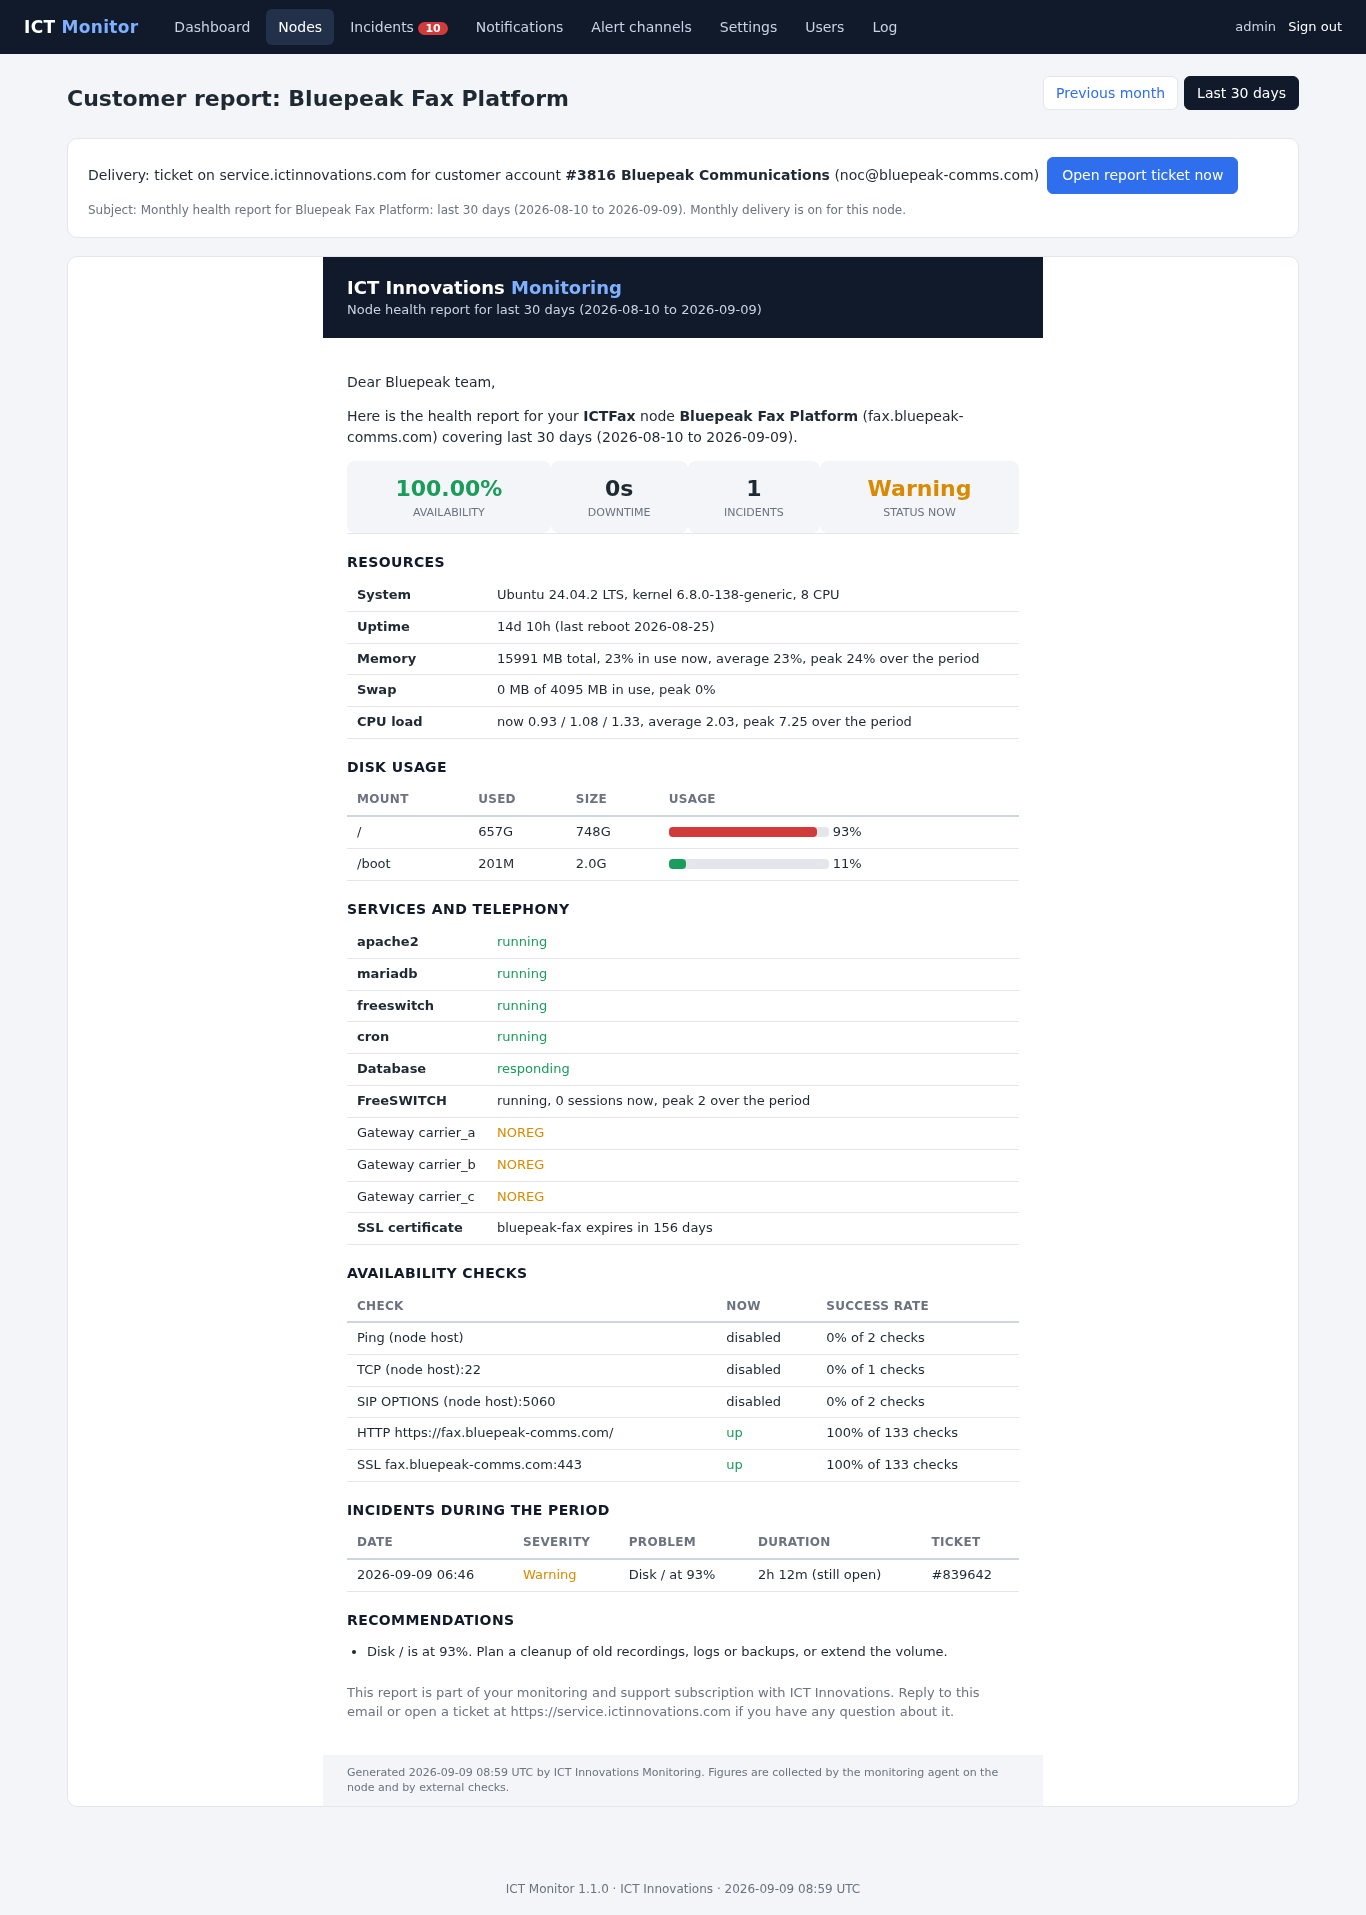
This is the document that tells you a server needs more disk two months before it becomes your problem. It is also the one to forward when somebody upstairs asks how the platform is doing.
Thresholds that fit the server
Warning and critical limits for disk, load, memory, swap, certificate expiry and response time are set globally and adjusted per node.
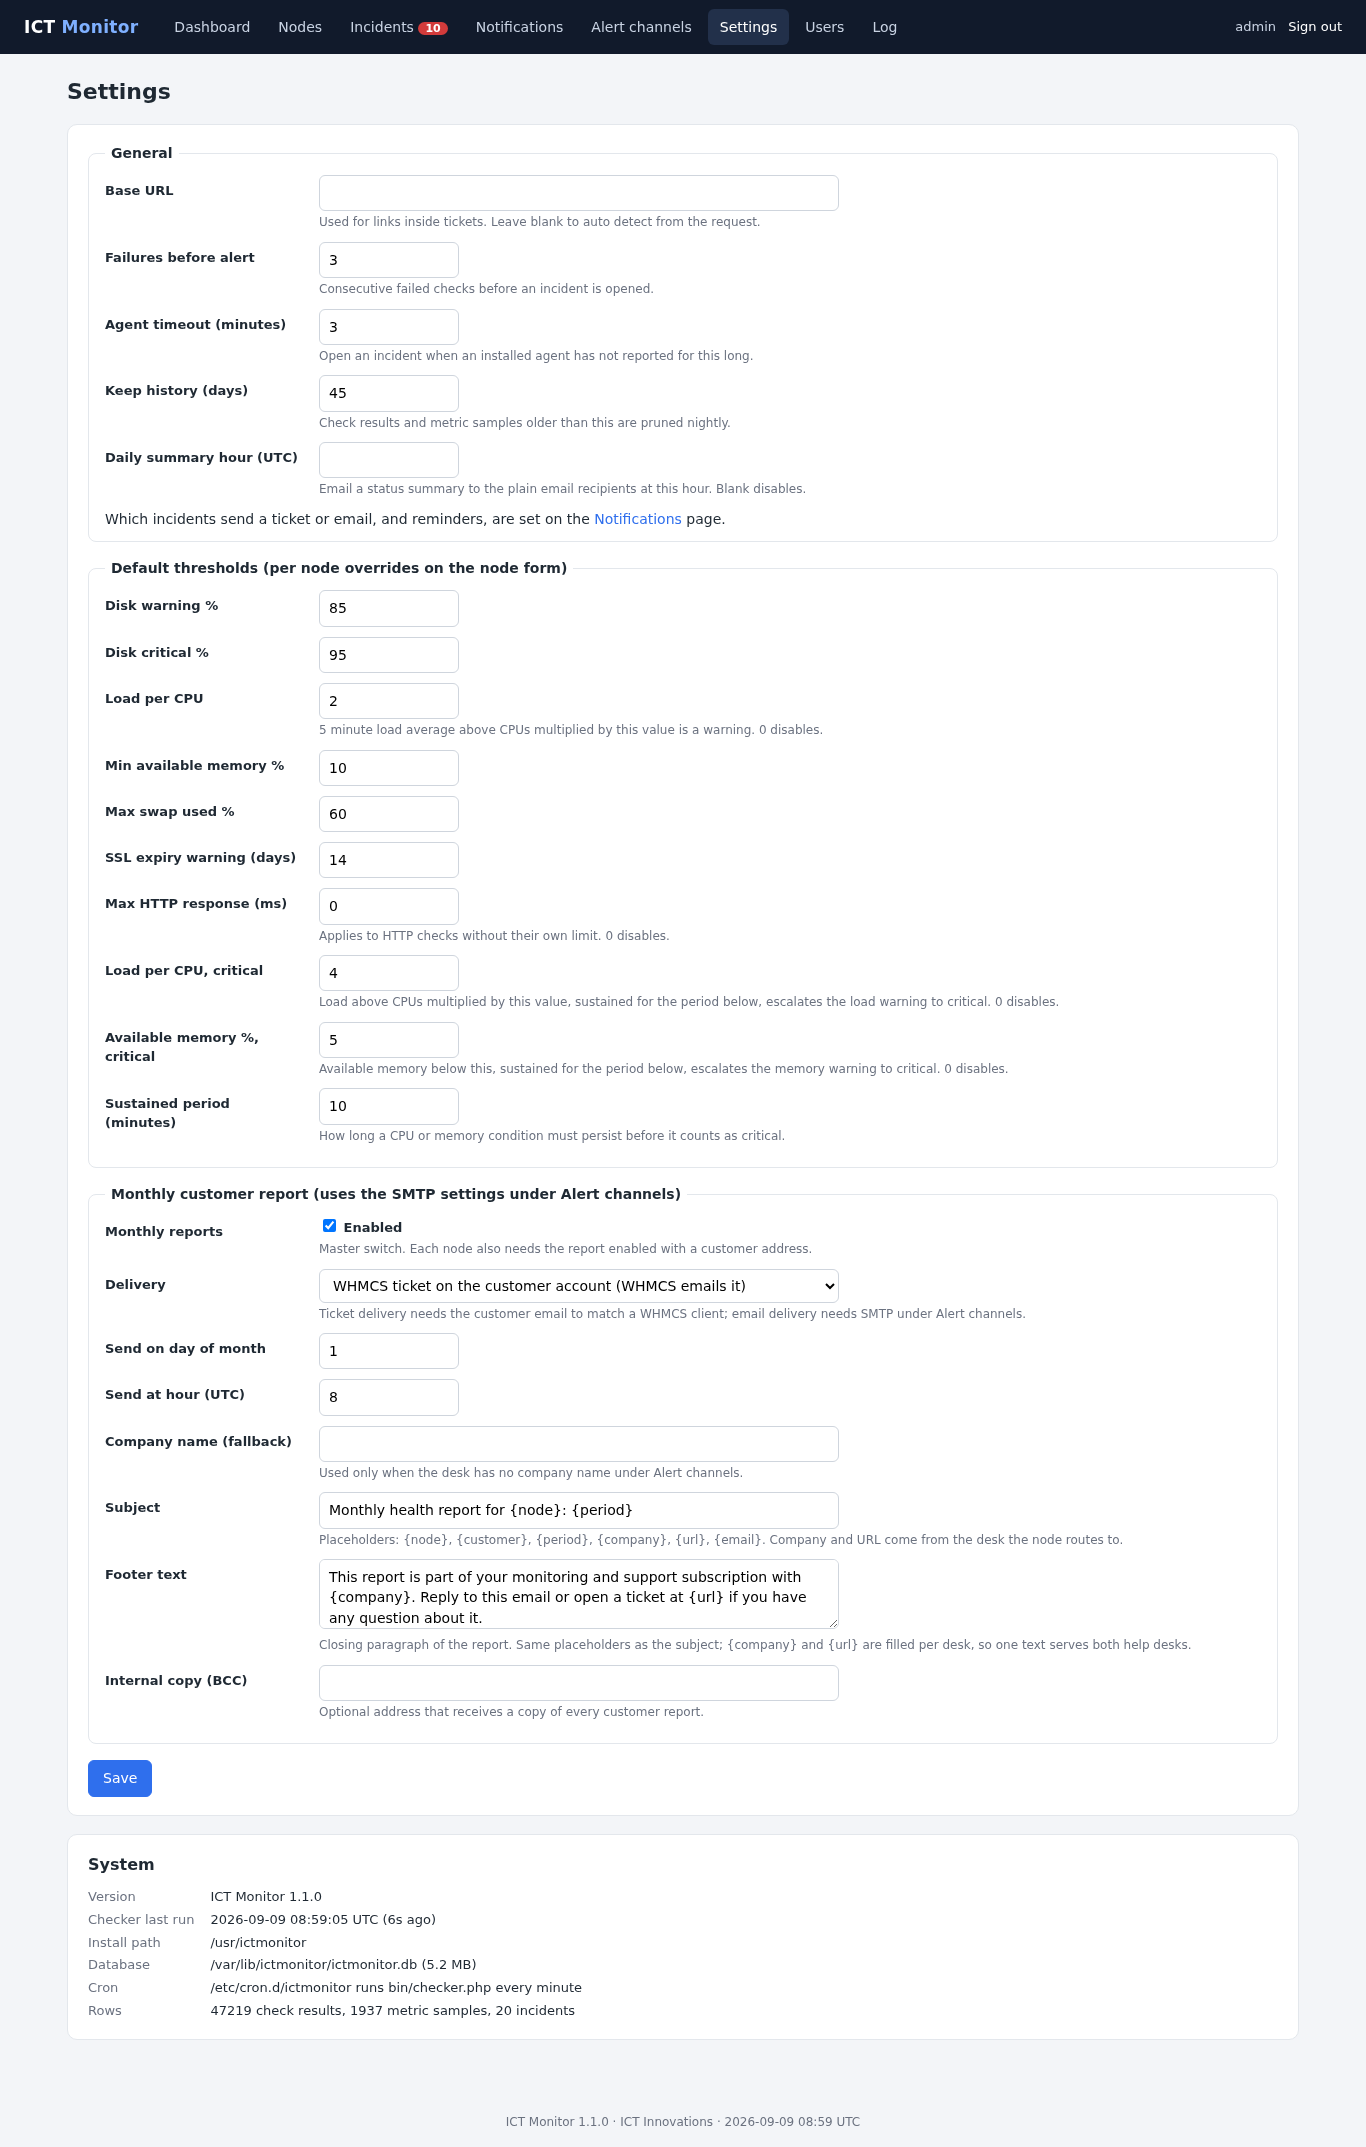
That flexibility is not decoration. A fax server sitting on a 2 TB archive and a four core dialer do not agree on what a normal disk or a normal load average looks like, and a threshold that fits one will either cry wolf or stay silent on the other.
What the yearly plan includes
- Monitoring of your production nodes with ICT Monitor, external checks and the agent, around the clock.
- Tickets opened by the monitoring system on your help desk account for critical problems, with recovery notices.
- Investigation and fix of what it finds, within the support terms of your plan.
- A monthly health report for each node.
- Product updates and security patches for the supported version, where the software is ours.
- Help with configuration questions, trunk and gateway setup, and routine operations.
We run it on our own products first
Everything above is exercised daily against the platforms we build, which is the reason the telephony checks exist at all. If you run any of these, monitoring is part of the support plan rather than an extra:
- ICTContact and ICTDialer, contact centre and outbound dialling on Asterisk, where the campaign daemon check earns its keep.
- ICTBroadcast, voice, SMS and fax broadcasting, same story at higher channel counts.
- ICTFax, the open source fax server on FreeSWITCH, where disk is usually the thing that bites first.
- ICTPBX, multi-tenant IP PBX, where a gateway dropping out affects every tenant behind it.
- ICTCRM, ICTDesk and ICT Exam, which are web and database nodes rather than switches, and are watched as such.
- Roshni, where the service is a confidential front door for people in difficulty, so availability is not an abstract number.
None of that is a requirement. A node running somebody else’s Asterisk build, or no telephony at all, is monitored the same way.
Getting started
If you run an Asterisk, FreeSWITCH or Linux server that matters to your business, open a ticket with us and we will set it up. Connecting a node is one command and about a minute.
Common questions
Does it only work with your software?
No. The agent reads standard things: systemd units, disk usage, memory, the Asterisk or FreeSWITCH command line if either is present. A Linux server running somebody else’s application is monitored the same way, minus any product specific check that does not apply. Tell us what the box looks like and we will confirm before you buy anything.
What does the agent install on my server?
A shell script and a cron entry. There is no daemon, no compiled binary and no package repository to add. It pushes metrics out over HTTPS, so it needs no inbound port opened for it.
Does the agent send you our call data?
No. It reports operational figures: load, memory, disks, service states, registration counts, channel counts. Not call recordings, not fax content, not numbers dialled.
Can I see the monitoring myself?
You see everything that produces a ticket, on your own help desk account, plus the monthly report. The dashboard itself is the tool our support team works from.
What if I want more alerts, not fewer?
Say so and we will raise the level for your nodes, or for one component. Some operators want to hear about every trunk registration loss, and that is a setting rather than a different product.